Bridge Pilings in Detail
Eight crossings, from the Emmett Shelton (Red Bud) bridge to I-35, plus Longhorn Dam. For each: what the National Bridge Inventory says about its spans, how deep the water is along the deck, and where release seams set up.
| Bridge | Spans (NBI 2025) | Length | Longest span | Built | Water width at deck analysis | Deepest under deck analysis |
|---|---|---|---|---|---|---|
| Emmett Shelton (Redbud Trail), spot 1B | 10 (+3-span relief bridge) | 121.9 m / 400 ft | 12.2 m / 40 ft | 1948 | 339 ft (east channel + island) | 9.4 ft |
| MoPac (Loop 1), 3A | SB 32+2; NB 36+8 | 944 m; 1,287 m | 31.4 m; 38.1 m | 1973 | 395 ft | 17.3 ft |
| Lamar Blvd, 6A | 6 | 200.9 m / 659 ft | 33.5 m / 110 ft | 1943 (concrete arch) | 504 ft | 19.5 ft |
| Pfluger Pedestrian, 6B | not in NBI | — | — | 2001 unverified | 528 ft | 20.0 ft |
| Union Pacific railroad, 6C | not in NBI | — | — | — | 552 ft (with islands) | 15.4 ft (south channel) |
| South 1st St, 8A | 6+1 | 247.5 m / 812 ft | 45.7 m / 150 ft | 1951 | 577 ft | 20.6 ft |
| Congress Ave, 8B | 8 | 290.8 m / 954 ft | 36.2 m / 119 ft | 1909 | 692 ft | 19.3 ft |
| I-35 main lanes, 10A | 9 | 320.7 m / 1,052 ft | 39.6 m / 130 ft | 1954 | 492 ft | 30.4 ft |
| I-35 frontage roads, 10A | NB 11+1; SB 8+2 | 412.7 m; 331 m | — | 1982 | — | — |
| Longhorn Dam / Pleasant Valley Rd, 12D | dam, not analyzed | — | — | — | — | 15–21 ft at the face |
Span counts, lengths and build years come from the FHWA National Bridge Inventory 2025 Texas file (FHWA NBI). I-35 is being rebuilt, so its piers may change unverified. Width and depth were measured along the OpenStreetMap deck centerline on my 2008 TWDB grid.
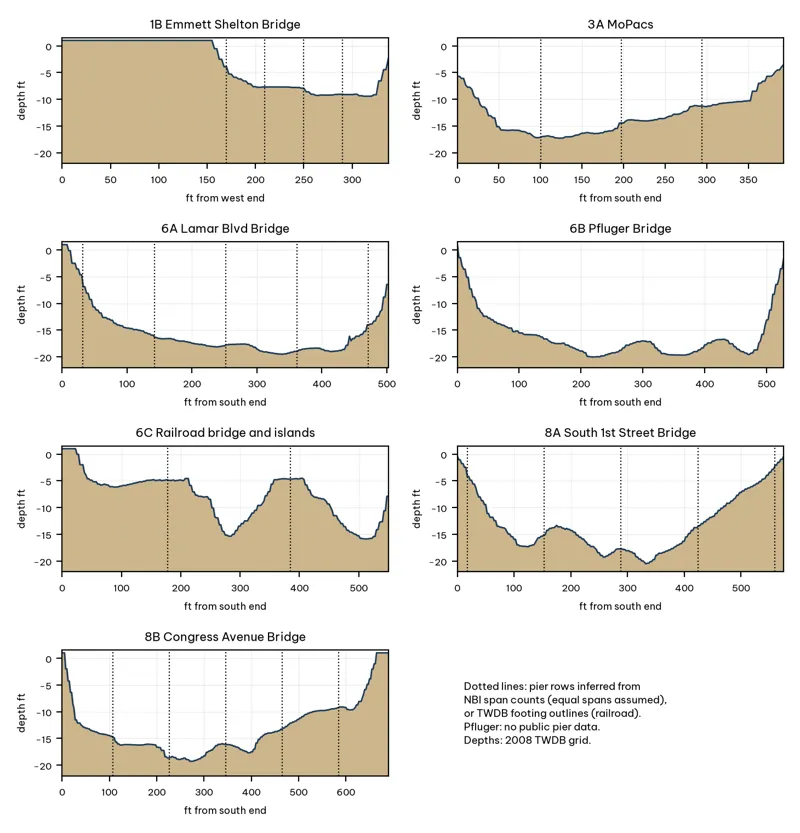
Where the piers are inference
- No public pier plans. I found no structural drawings for these bridges online. The NBI gives the number of spans and the longest span, but not where each pier stands.
- How the pier markers were placed. On the spot maps, piers are spaced evenly at the bridge's average span length (total length ÷ spans) and centered on the river. That's an assumption, and real piers can be off by tens of feet inference. Lamar's arch spans and Congress's spans are fairly even; MoPac's piers in the water are a small part of a long viaduct.
- Railroad bridge. This one uses real geometry: TWDB's 2008 GIS includes two footing outlines, which sit on the shallow bars mid-river (TWDB 2008 shapefiles).
- Pfluger. No public data on its piers.
Where the current seam sets up during releases inference
- Which way the water goes. When Tom Miller generates, water moves downstream: south through Reach 1, then east-southeast. Each pier splits the flow. The slack pocket and the eddy line form on the downstream (east) side of each pier and trail off for a few pier-widths.
- Where it's strongest. The deepest span carries the most water, so the strongest seam is behind the piers that flank the deepest span:
- Lamar: around 340 ft from the south end.
- 1st St: around 330 ft.
- Congress: around 270 ft.
- MoPac: around 120 ft.
- How to fish it. Hold upstream and slightly to one side, cast past the pier, and let the bait swing into the slack. Bass usually face upstream at the head of the slack water.
- When it fades. Release current fades with distance from the dam. Seams are strongest at Red Bud and MoPac and weaker downtown analysisinference.
Under the bridges
The City's 2025 swimming-hazard memo maps bridge-construction debris (broken concrete, rebar) at the Red Bud bridge, MoPac, Lamar/Seaholm, 1st St, Congress and I-35 (City of Austin 2025). Expect hard snags at the bases of the piers.
Bottom Type and Grass
The bottom-type map is carried over from v2 and covers the upper lake (Reaches 1–8). TPWD's 2019 survey found native plants on only about 0.8% of the whole lake ([TPWD 2019](https://tpwd.texas.gov/publications/pwdpubs/media/lake_survey/pwd_rp_t3200_1385_2019.pdf)).
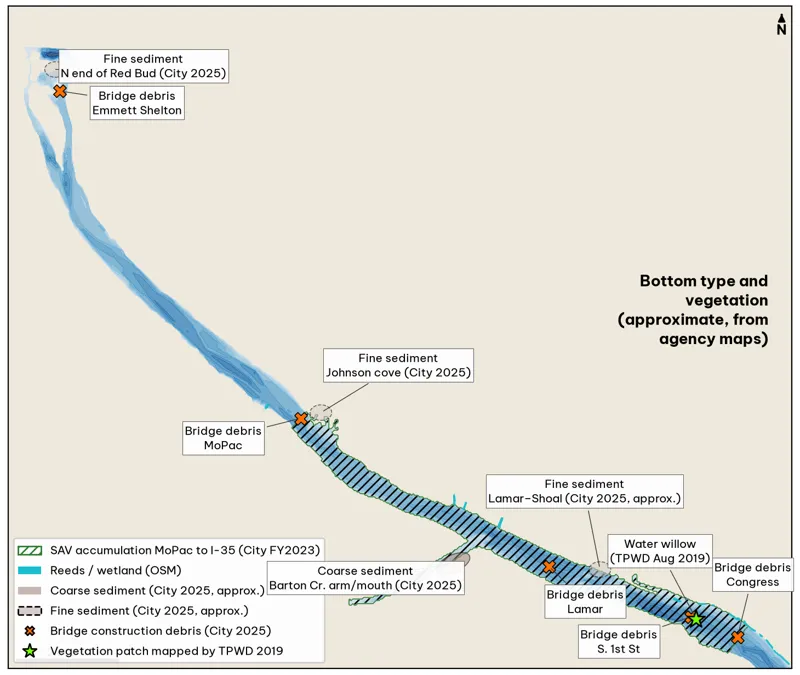
Approximate zones only. The sediment and debris locations were traced by eye from the City's 2025 Exhibit 1 hazard maps. The hatched band is the City's description of where vegetation piles up. The star is TPWD's mapped 2019 patch.
Bottom type: what exists analysis
- No bottom-type survey has been published. TWDB's 2008 survey measured depth only, and it took no sediment cores here (TWDB 2009). The 2025 TWDB resurvey for the City isn't published yet unverified.
- The best available source is the City's September 2025 swimming memo (City of Austin 2025). It maps:
- Coarse sediment: the Barton Creek arm and mouth.
- Fine sediment: the north end of Red Bud, the Johnson / MoPac cove, near Lamar–Shoal, plus Waller Creek and the Longhorn basin (both outside this guide).
- Bridge construction debris: at every road bridge.
- Old dams. The memo says remnants of the 1900s Austin dam, and a partially collapsed dam near Seaholm, create unpredictable eddies. It gives no exact locations unverified.
- What it means for fishing inference:
- Coarse gravel at Barton is the closest thing to a hard bottom on the lake, so expect crawfish there.
- Soft fine-sediment flats (Johnson, Red Bud north) are where grass roots first after a flood.
Grass: locations and timing
| Source | What it says |
|---|---|
| TPWD 2019 survey | Only 4.0 acres (0.8%) of vegetation lake-wide, all native emergent (cattail, bulrush, water willow, etc.). No submerged grass, no hydrilla ever established. In this guide's stretch, the only mapped patch is water willow on the north bank just upstream of 1st St (spot 8C) (TPWD 2019) |
| TPWD history | Fanwort covered 17–34% of the lake in 2012–2015 and "traversed the width" of the lake at the Barton confluence in 2013. Floods scoured it out by 2016 (same report) |
| City FY2023 | "Water very clear above Lamar" lets grass grow in deeper water. Vegetation is accumulating "between MoPac and I-35." Submerged grass returns between flushing floods, a "boom and bust" pattern (City of Austin FY2023) |
| City FY2024–25 | Fanwort reaches the surface July–September from Red Bud to I-35 (City of Austin) |
| City 2025 hazard map | Dense submerged vegetation and algae marked across nearly the whole lake from Red Bud through the Barton arm. Minimal at the Deep Eddy north shore above MoPac (City 2025) |
Seasonal timing analysisinference
- Spring (Mar–May): new growth on soft flats (Johnson, Barton lip, Red Bud north). Grass edges are short and easy to fish.
- Summer (Jul–Sep): fanwort topped out at the surface from Red Bud to I-35. Fish the outside edge, or the open lanes over the channel walls (2A, 3B, 7A).
- Fall (Oct–Nov): grass starts dying back below the surface. A glide or swimbait run just over the tops works while the grass lasts. Right now (mid-October) you should still expect submerged grass on the flats unverified.
- Winter: grass mostly gone below about 6 ft. A big flood resets everything; after one, expect bare bottom for a season or more.
The conflict
TPWD's 2019 number (0.8% cover, no submerged grass) and the City's 2023–2025 descriptions (submerged grass widespread) are six years apart, and the City notes the system booms and busts. Trust the newer City picture for 2026, and verify on the water unverified.
Sun, Shade and Wind Exposure
Today's sun (Monday, Oct 12, 2026, Austin) analysis
Sunrise is about 7:35 am and sunset about 7:00 pm CT. I computed these with NOAA's solar-position equations at 30.27° N, 97.765° W. Published tables may differ by 1–3 minutes.
| Time (CT) | 8:05a | 9:00a | 10:00a | 11:00a | 12:00p | 1:00p | 2:00p | 3:00p | 4:00p | 5:00p | 6:00p | 6:30p |
|---|---|---|---|---|---|---|---|---|---|---|---|---|
| Sun elevation | 6° | 18° | 29° | 40° | 48° | 52° | 51° | 45° | 36° | 25° | 12° | 6° |
| Sun azimuth | 103° | 110° | 120° | 133° | 151° | 173° | 197° | 217° | 233° | 244° | 253° | 257° |
Which bank is shaded, hour by hour analysisinference
Each cell is the width (ft) of tree shadow on the water, assuming a 40-ft bank tree line. Bold cells are 40 ft or more, which is enough to keep a swimbait or glide in shade for most of the cast. Bank names follow each reach's orientation; R1 runs north–south, so its banks are east and west.
| Reach · bank | 8:05a | 9:00a | 10:00a | 11:00a | 12:00p | 1:00p | 2:00p | 3:00p | 4:00p | 5:00p | 6:00p | 6:30p |
|---|---|---|---|---|---|---|---|---|---|---|---|---|
| R1 · E bank | 352 | 117 | 61 | 35 | 18 | 4 | – | – | – | – | – | – |
| R1 · W bank | – | – | – | – | – | – | 10 | 24 | 44 | 79 | 173 | 358 |
| R2 · NE bank | 199 | 54 | 19 | 2 | – | – | – | – | – | – | – | – |
| R2 · SW bank | – | – | – | – | 9 | 19 | 29 | 40 | 55 | 83 | 160 | 313 |
| R3 · NE bank | 174 | 45 | 14 | – | – | – | – | – | – | – | – | – |
| R3 · SW bank | – | – | – | 2 | 12 | 21 | 30 | 40 | 55 | 81 | 153 | 297 |
| R4 · NE bank | 109 | 21 | – | – | – | – | – | – | – | – | – | – |
| R4 · SW bank | – | – | – | 11 | 18 | 25 | 32 | 40 | 52 | 73 | 132 | 249 |
| R5 · NE bank | 69 | 7 | – | – | – | – | – | – | – | – | – | – |
| R5 · SW bank | – | – | 8 | 16 | 22 | 27 | 32 | 39 | 49 | 67 | 117 | 217 |
| R6 · N bank | 54 | 2 | – | – | – | – | – | – | – | – | – | – |
| R6 · S bank | – | – | 11 | 18 | 23 | 28 | 33 | 39 | 48 | 64 | 111 | 204 |
| R7 · N bank | 53 | 2 | – | – | – | – | – | – | – | – | – | – |
| R7 · S bank | – | – | 11 | 18 | 23 | 28 | 33 | 39 | 48 | 64 | 110 | 203 |
| R8 · NE bank | 100 | 18 | – | – | – | – | – | – | – | – | – | – |
| R8 · SW bank | – | – | 2 | 12 | 19 | 25 | 32 | 40 | 51 | 71 | 128 | 242 |
| R9 · NE bank | 260 | 78 | 34 | 13 | – | – | – | – | – | – | – | – |
| R9 · SW bank | – | – | – | – | 1 | 13 | 24 | 37 | 56 | 87 | 175 | 348 |
| R10 · NE bank | 103 | 20 | – | – | – | – | – | – | – | – | – | – |
| R10 · SW bank | – | – | 1 | 12 | 19 | 25 | 32 | 40 | 51 | 72 | 130 | 245 |
| R11 · N bank | – | – | – | – | – | – | – | – | – | – | – | – |
| R11 · S bank | 38 | 30 | 29 | 29 | 29 | 30 | 32 | 35 | 39 | 47 | 71 | 121 |
| R12 · NW bank | – | – | – | – | – | – | – | – | – | – | 21 | 69 |
| R12 · SE bank | 212 | 87 | 57 | 44 | 36 | 30 | 25 | 20 | 13 | 4 | – | – |
Method: shadow width = 40 ft ÷ tan(sun elevation) × cos(sun azimuth − direction from water to land). The 40-ft tree height is an assumption inference. Bulkheads and lawns cast little or no shade.
What it means in October analysis
- Mornings: the north / northeast bank (east bank in R1) is shaded until about 9–10 am.
- Afternoons: the south / southwest bank picks up shade from about noon and holds it until dark. That makes the south-bank spots the best afternoon picks: 2A, 2B, 3B, 4B, 5A, 7A, 7C, 8D, and east of Congress 9E, 10D, 11D and 11E. Reach 11 runs almost due east, so its north bank gets no tree shade today; the I-35 decks (10A) are shaded all day analysis.
Wind exposure from fetch analysis
Fetch is how far the wind blows over open water before it reaches you. More fetch means more chop. I measured it at 12 points along each reach's centerline by casting a line upwind across my 2008 water mask until it hit land. Each cell gives the median fetch in ft, with the maximum in parentheses.
| Reach | River bearing | S wind | SE wind | N wind | NW wind | Exposure under S/SE | Exposure under N/NW front |
|---|---|---|---|---|---|---|---|
| R1 Dam–Red Bud | 180° | 580 (1,670) | 150 (610) | 570 (2,190) | 120 (660) | Low | Low |
| R2 Red Bud–MoPac | 136° | 330 (540) | 2,870 (5,610) | 355 (1,380) | 2,525 (5,460) | High | High |
| R3 MoPac | 131° | 240 (330) | 1,910 (2,570) | 440 (500) | 3,450 (3,710) | High | High |
| R4 Austin High–Zilker | 120° | 215 (430) | 690 (1,220) | 220 (390) | 820 (3,480) | Moderate | Moderate |
| R5 Barton mouth | 114° | 245 (390) | 640 (790) | 325 (370) | 810 (920) | Moderate | Moderate |
| R6 Lamar–RR bridge | 111° | 350 (390) | 760 (850) | 230 (280) | 560 (740) | Moderate | Low |
| R7 Shoal–1st St | 111° | 240 (370) | 550 (1,000) | 235 (350) | 520 (800) | Low | Low |
| R8 1st St–Congress | 119° | 410 (450) | 2,080 (2,590) | 400 (440) | 790 (970) | High | Moderate |
| R9 Congress–Blunn | 149° | 750 (1,460) | 1,010 (2,870) | 585 (900) | 1,080 (2,360) | Moderate | Moderate |
| R10 Blunn–Festival Beach | 119° | 370 (530) | 1,015 (1,670) | 305 (470) | 820 (3,050) | Moderate | Moderate |
| R11 Festival–Holly | 97° | 360 (400) | 505 (870) | 375 (430) | 755 (1,100) | Low | Moderate |
| R12 Lower basin–Longhorn Dam | 67° | 1,290 (2,180) | 910 (1,810) | 350 (530) | 300 (460) | Moderate | Low |
Exposure: High = median fetch at least 1,500 ft; Moderate = 600–1,500 ft; Low = under 600 ft. Austin's October wind is predominantly from the south, averaging 8.4–9.5 mph (WeatherSpark).
How to use it analysisinference
- S/SE wind (most days).
- R2, R3 and R8 run SE–NW, so a SE wind gets a long run up the channel. Expect real chop there.
- A straight south wind crosses every reach the short way (under 600 ft), so it barely matters on the water. It does blow onto the north banks: 2C, 3C, 4C, 5C, 6E, 7B, 8C.
- Wind-blown banks stack bait. Fish the north-bank spots on a south wind.
- North front.
- NW winds rake R2 and R3 (median fetch 2,500–3,450 ft), so you'll want shelter.
- The best shelter is R1 (dam and bluffs), R6–R7 (bridges and short fetch), and the bridge decks themselves.
- A north wind blows onto the south banks: 2A, 2B, 3B, 4B, 7A, 7C.
- Kayak safety. Above about 15 mph from the SE or NW, R2 and R3 are the stretches to avoid inference.
Reading the Water: LCRA Releases and the Barton Springs Gauge
Tom Miller Dam releases (LCRA)
- Open the LCRA River Operations Report. LCRA posts the previous day's releases each weekday. It says releases "are made to meet customer or environmental needs," and that the hydropower schedule for the day "is not available to the public." No one can tell you in advance exactly when the dam will run.
- Find the "Austin (Miller)" line. It gives the hours water ran and an average discharge in cfs. The same numbers are in LCRA's data feed (LCRA data feed).
- What the numbers mean. On Oct 12, 2026, the feed (dated Oct 11, 7:55 am) listed Tom Miller at 6–8 pm, average 146 cfs, 289.6 acre-feet. Because 146 cfs for a full day equals 289.6 acre-feet, the "average" appears to be spread over 24 hours. So the flow while the turbines were actually running was several times higher analysis. On Oct 11, the same feed showed 6–10 pm, 290 cfs (575 acre-feet), which the earlier report dated to Oct 10. I can't confirm which calendar day each line covers unverified.
- Watch for floodgates. LCRA's flood status page shows floodgate operations. Floodgate releases are not fishing water.
- Check the river below. The same feed lists flow at the "Colorado River at Austin" gauge downstream. Its average was 337 cfs at 11:25 am on Oct 12, 2026 (same feed).
Pro tip
One or two days of data aren't a pattern. Both days I captured were evening releases, but I couldn't download a longer history to prove that's the norm unverified. Keep your own log of release times and how the fish responded. Within a season, it will become the most valuable page in this guide analysis.
Barton Springs (USGS 08155500)
- Where to look. USGS monitoring location 08155500 reports water temperature and discharge every 15 minutes.
- Reading at 11:00 am CT, Oct 12, 2026: 22.1°C (71.8°F), 21 cfs (provisional) (USGS instantaneous values).
- What it means.
- The temperature barely changes. All of 2025 stayed between 21.5 and 22.1°C (2025 daily values).
- The flow is the number to watch. More flow makes a bigger warm (winter) or cool (summer) plume at the Barton mouth in Reach 5 analysis.
- TPWD's long-term average works out to about 50 cfs (analysis, from 32 million gallons a day, per TPWD).
- Low river, no rain. When upstream releases are low and it hasn't rained, groundwater from Barton Springs makes up "the majority of the inflow to the lake" (TXST 2019).
Winter tip for Reach 5
Check the USGS gauge before a winter trip. When spring flow is up, the warm Barton Creek plume is bigger. The flow was 21 cfs today, against a long-term average of about 50 cfs analysis.
After rain
- Bacteria. E. coli rises at every City sampling site one to two days after rain (City of Austin 2020). The City advises staying out of natural water for three days after rain (City of Austin).
- Where it muddies. Downtown (Reaches 6–8) muddies first. The upper lake stays cleaner analysis.
Weather, Fronts and Busy Hours
Front playbook inference
These stages are standard bass-angler practice, adapted to this lake's structure. They are not measured on Lady Bird.
| Stage | Signs | Where | What |
|---|---|---|---|
| Pre-front (6–24 h before) | Falling pressure, south wind 10–20 mph, clouds | Wind-blown north banks and shelf edges (2C, 3C, 4C, 5C, 7B, 8C) | Bladed jig fast, spinnerbait, lipless across flats. Often the best window of the week |
| Front passing | Wind swings W→N, gusts, rain | Bridges and sheltered R1, R6–R7 | Bladed jig through the pier seams. Get off the water if there's lightning |
| Post-front day 1–2 | Rising pressure, bluebird sky, north wind | Deep side of the steep walls (2A, 3B, 7A, 1A), plus bridge shade | Slow down: jig on the base, jerkbait with long pauses, downsize the trailer |
| Stable warming (day 3+) | Wind back to S/SE | Back to the breaks and flats | Resume the normal seasonal pattern |
Pressure notes inference
- Use the trend, not the number. A steady fall before a front usually means active fish. A fast rise behind it usually means a tough bite for a day or two. WeatherSpark's daily history pages show each October front as a pressure swing you can check after a trip (WeatherSpark history).
- Releases trump pressure here. Above Lamar, a generation release can switch fish on even on a post-front day. Check the LCRA data (see "Reading the Water") analysis.
- Barton is a front buffer. The spring water is a steady 71–72°F. After a hard winter front, the Barton plume (5A, 5B) is the warmest water in the lake analysis.
Busy hours: trail and water
| When | What's happening | Source |
|---|---|---|
| Weekdays 5–9 pm | Peak trail use: runners and walkers on every bank | Trail Conservancy safety study |
| Weekends 9–11 am | Peak weekend trail use (the study's count window) | same |
| Before sunrise / after sunset | "Very few users" on the trail | same |
| Daylight, daily | Kayak and paddleboard rentals: Rowing Dock (R2–R3) and Texas Rowing Center (R4) | Rowing Dock, TRC |
| Early morning | Rowing shells use the center channel; stay in the bank lanes | Austin Rowing Club |
| Oct 8–21 ≈ 6:30 pm | Capital Cruises bat boat departs; kayak tours head for Congress | Capital Cruises |
| Tonight 6:57–7:34 pm | Projected bat emergence at Congress, about 10 min after sunset. Bats begin leaving in October | congressbats.com, Austin Bat Refuge |
Beat the crowds inference
- Quietest water: sunrise to about 8:30 am on weekdays.
- Downtown evenings: skip R8 (Congress, 8B) from about 6 pm to dark from March to October, when bat boats and kayaks crowd it.
- Alternatives: R1 and R2 rarely see the downtown crowds.